浙江连续两次暖区飑线发展机制分析
Analysis on development mechanism of two consecutive warm zone squall lines in Zhejiang Province
浙江连续两次暖区飑线发展机制分析 |
| 钱卓蕾, 赵驰宇, 朱哲君, 沈哲文 |
|
Analysis on development mechanism of two consecutive warm zone squall lines in Zhejiang Province |
| QIAN Zhuolei, ZHAO Chiyu, ZHU Zhejun, SHENG Zhewen |
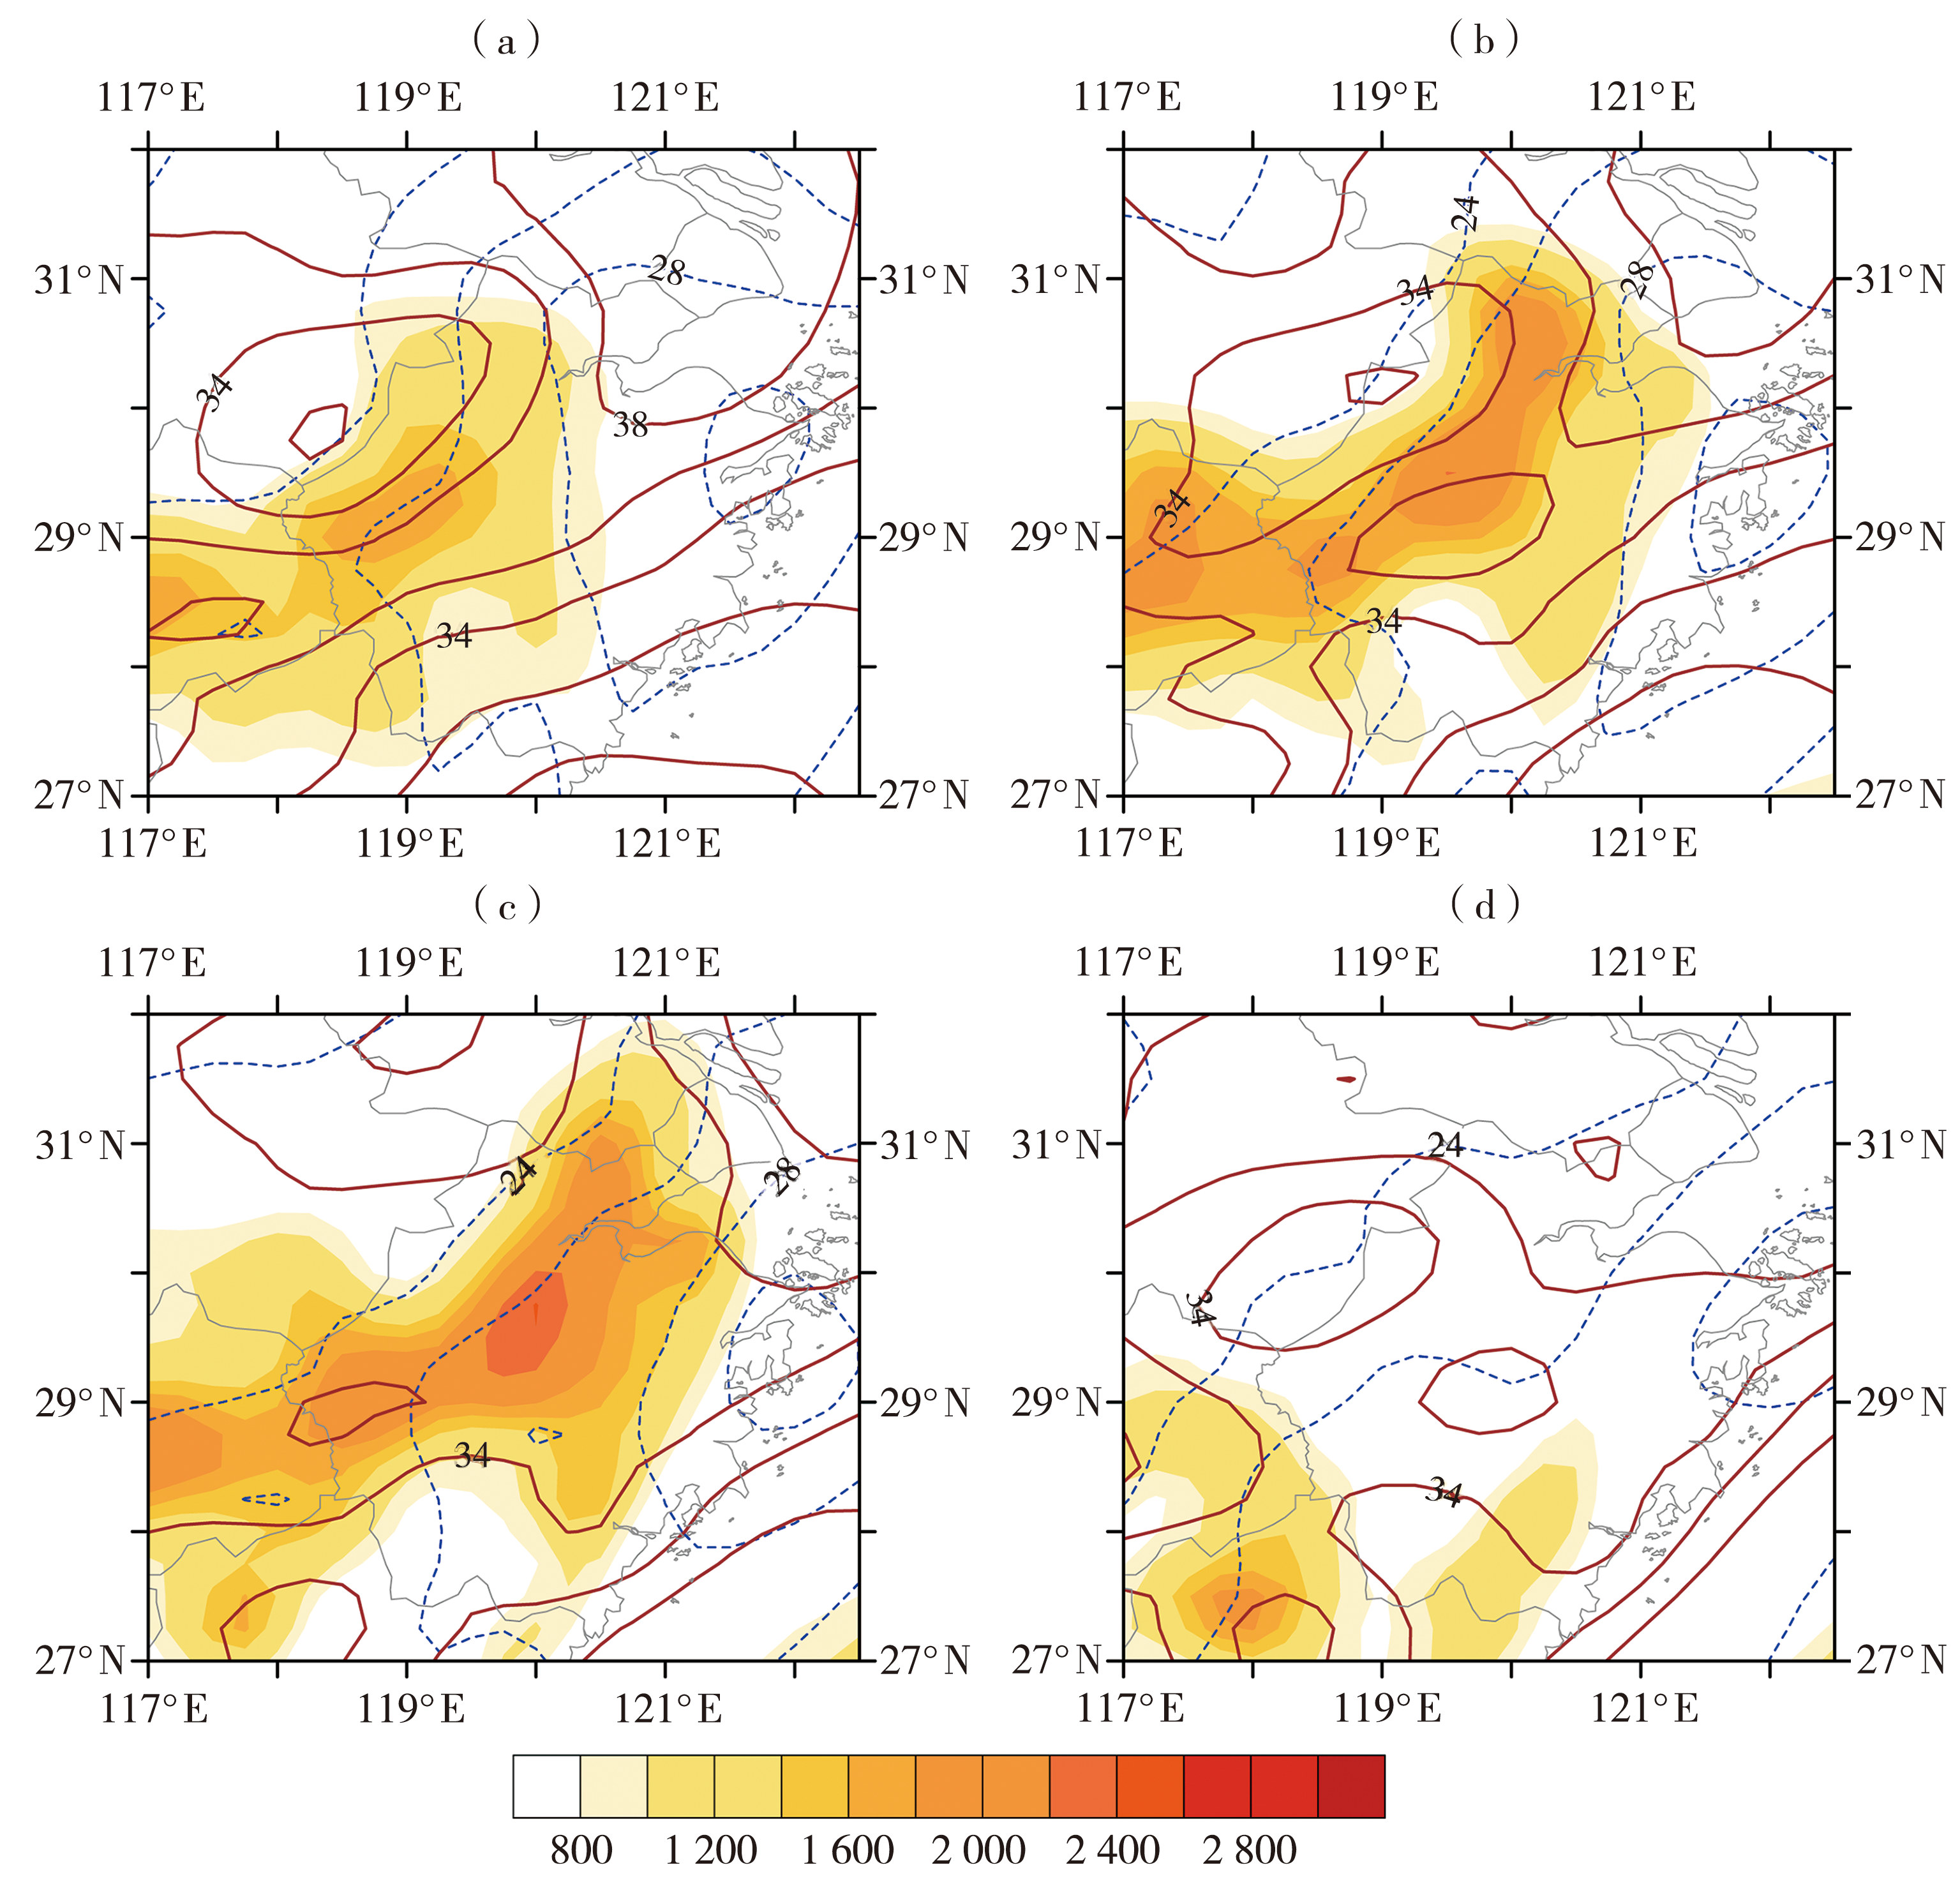
| 图4 2022年4月25日12:00(a)、14:00(b)、16:00(c)和18:00(d)对流有效位能(填色,单位:J·kg-1)、K指数(棕色实线,单位:℃)和850 hPa与500 hPa温差分布(蓝色虚线,单位:℃) |
| Fig.4 Distribution of convective effective potential energy (color shaded, Unit: J·kg-1), K index (brown solid lines, Unit: °C) and temperature difference between 850 hPa and 500 hPa (blue dotted lines, Unit: °C) at 12:00 (a), 14:00 (b), 16:00 (c) and 18:00 (d) on 25 April 2022 |
|
|