两次极端强降水风暴双偏振参量特征对比分析
|
|
郭飞燕, 刁秀广, 褚颖佳, 李欣, 陆雪, 张少博
|
Contrast analysis of dual-polarization signatures for the two extreme rainfall storms
|
|
GUO Feiyan, DIAO Xiuguang, CHU Yingjia, LI Xin, LU Xue, ZHANG Shaobo
|
|
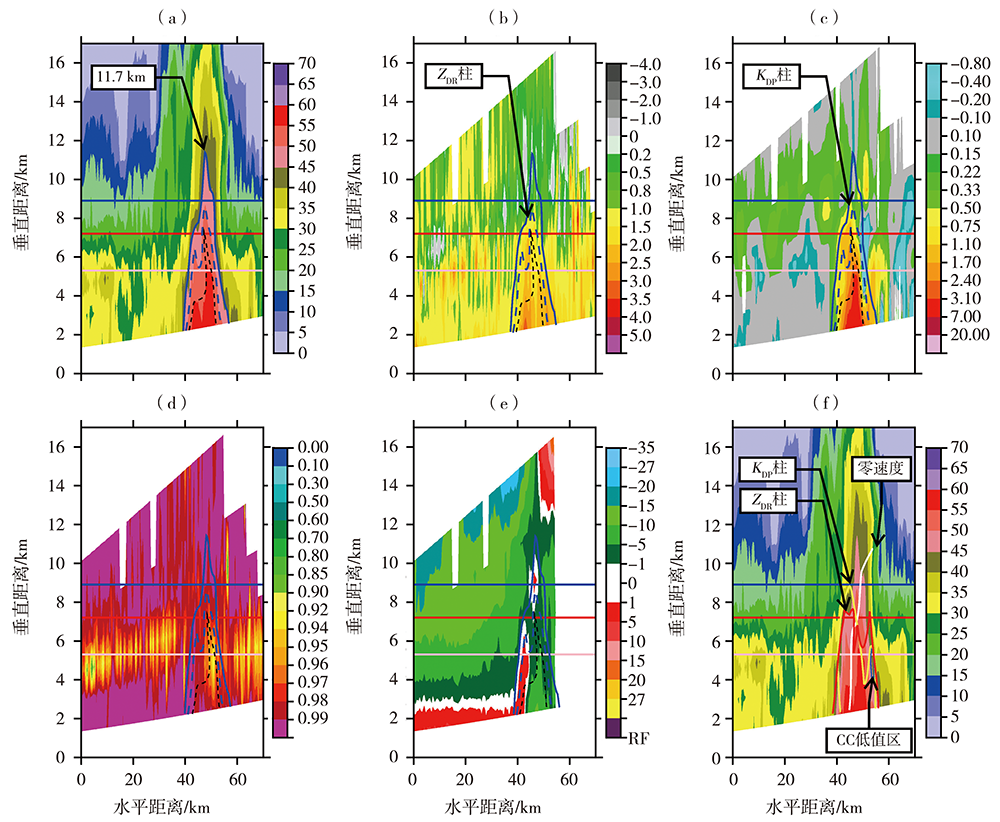
图4 2020年8月5日07:16济南雷达ZH(a,单位:dBZ)、ZDR(b,单位:dB)、KDP[c,单位:(°)·km-1]、CC(d)、V(e,单位:m·s-1),及叠加了ZDR、KDP、CC和零速度等值线的ZH(单位:dBZ)(f)垂直剖面
[蓝色实等值线、虚等值线、点线分别为ZH=45、50和55 dBZ等值线;粉、红和蓝色水平直线分别是环境0 ℃、-10 ℃和-20 ℃层高度;图4(f)中红色等值线是ZDR=1.0 dB等值线,黄色等值线是KDP=1.00(°)·km-1等值线,白色等值线为零速度等值线。下同]
|
Fig.4 Vertical cross-section(VCS) of ZH (a, Unit: dBZ), ZDR (b, Unit: dB), KDP (c,Unit:(°)·km-1), CC (d),V(e,m·s-1), and VCS of ZH (Unit: dBZ) overlying ZDR, KDP, CC and zero velocity isoline from Ji'nan radar at 07:16 on 5 August 2020
(The blue solid, dash and dotted isolines are 45, 50 and 55 dBZ isoline of ZH respectively; the pink, red and blue isolines are the heights of 0 ℃, -10 ℃ and -20 ℃ layers respectively; the red isoline is 1 dB isoline of ZDR, the yellow isoline is 1.00(°)·km-1 isoline of KDP, the white isoline is 0 m·s-1 isoline of V in Fig.4(f). The same as below)
|
|
|
|
|