台风“摩羯”路径转折预报和诊断分析
于慧珍1,2( ), 马艳1,2(), 韩旭卿3, 时晓曚1,2
), 马艳1,2(), 韩旭卿3, 时晓曚1,2
Forecast and diagnosis analysis of the turning of Typhoon Yagi track
YU Huizhen1,2(), MA Yan1,2(), HAN Xuqing3, SHI Xiaomeng1,2
), MA Yan1,2(), HAN Xuqing3, SHI Xiaomeng1,2
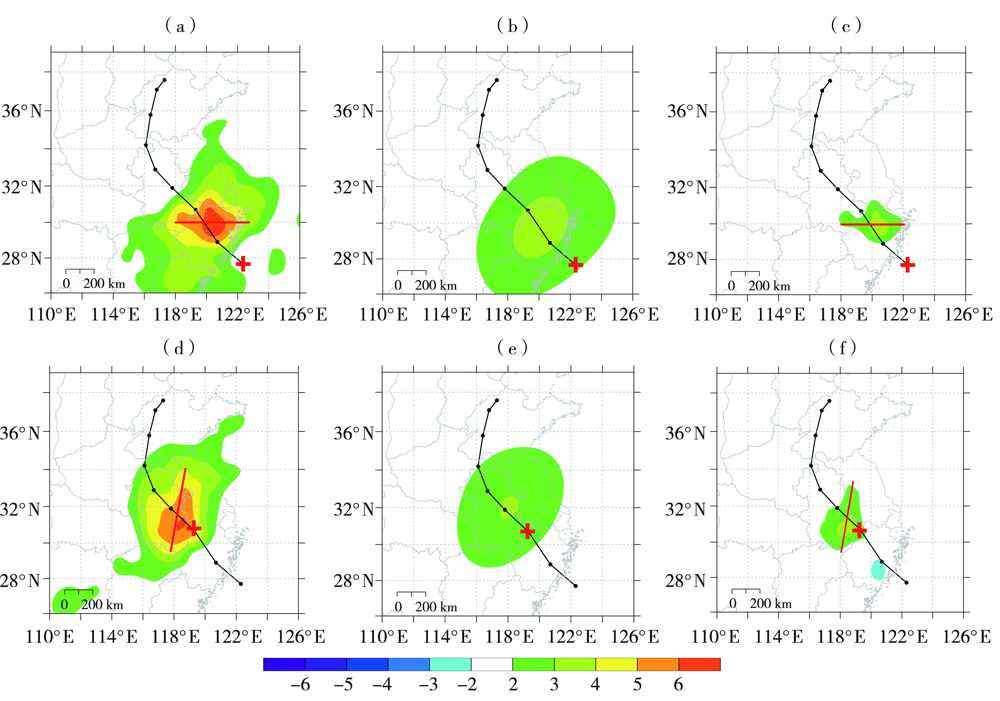
图7. 2018年8月12日20:00(a、b、c)和13日08:00(d、e、f)300 hPa 24 h变温场(a、d)及其大尺度(b、e)和风暴尺度(c、f)分量(单位:K)
(红色线代表强增温中心轴线方向,红色十字代表相应时刻的台风位置)
Fig.7. The 24 h temperature variation at 300 hPa (a, d) and its large scale (b, e) and storm scale (c, f) components at 20:00 BST 12 (a, b, c) and 08:00 BST 13 (d, e, f) August 2018 (Unit: K)
(The red line denotes the axis direction of strong warming center and the red cross denotes the typhoon location at the corresponding time)