台风“摩羯”路径转折预报和诊断分析
于慧珍1,2( ), 马艳1,2(), 韩旭卿3, 时晓曚1,2
), 马艳1,2(), 韩旭卿3, 时晓曚1,2
Forecast and diagnosis analysis of the turning of Typhoon Yagi track
YU Huizhen1,2(), MA Yan1,2(), HAN Xuqing3, SHI Xiaomeng1,2
), MA Yan1,2(), HAN Xuqing3, SHI Xiaomeng1,2
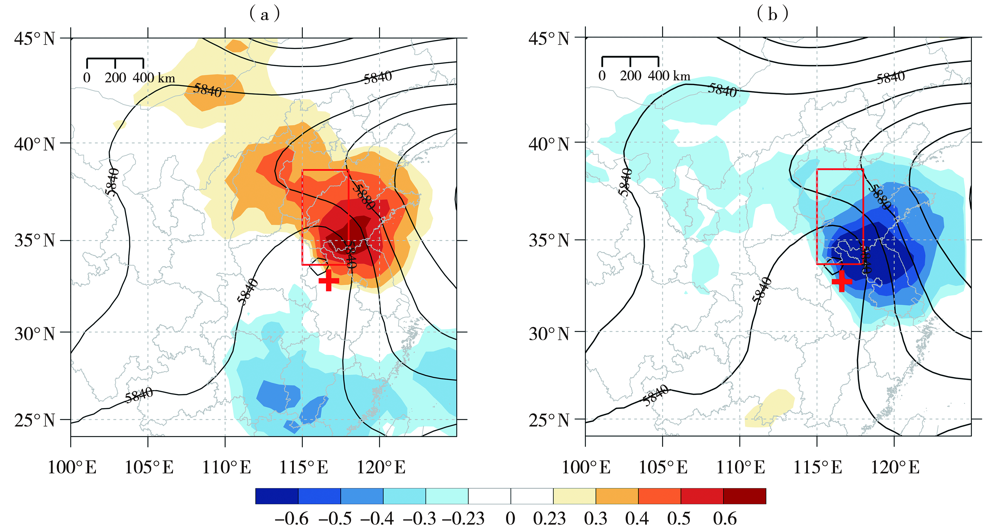
图4. 2018年8月12日08:00起报的13日20:00 500 hPa位势高度场的集合平均(黑色等值线,单位:gpm)(a,b)及其分别与相同时刻起报的24 h区域平均的海平面气压(a)、10 m风速(b)的线性相关系数(彩色填色区)
(红色十字为13日20:00观测的台风位置)
Fig.4. The ensemble mean of geopotential height at 500 hPa at 20: 00 BST 13 forecasted initiated from 08: 00 BST 12 August 2018 (black contours, Unit: gpm) (a, b) and correlation coefficient (color shaded areas) between it and the 24 h area-averaged sea level pressure (a), wind speed at 10 m (b) forecasted at same initiated time
(The red cross denotes the observed typhoon location at 20:00 BST 13 August 2018)