台风“摩羯”路径转折预报和诊断分析
于慧珍1,2( ), 马艳1,2(), 韩旭卿3, 时晓曚1,2
), 马艳1,2(), 韩旭卿3, 时晓曚1,2
Forecast and diagnosis analysis of the turning of Typhoon Yagi track
YU Huizhen1,2(), MA Yan1,2(), HAN Xuqing3, SHI Xiaomeng1,2
), MA Yan1,2(), HAN Xuqing3, SHI Xiaomeng1,2
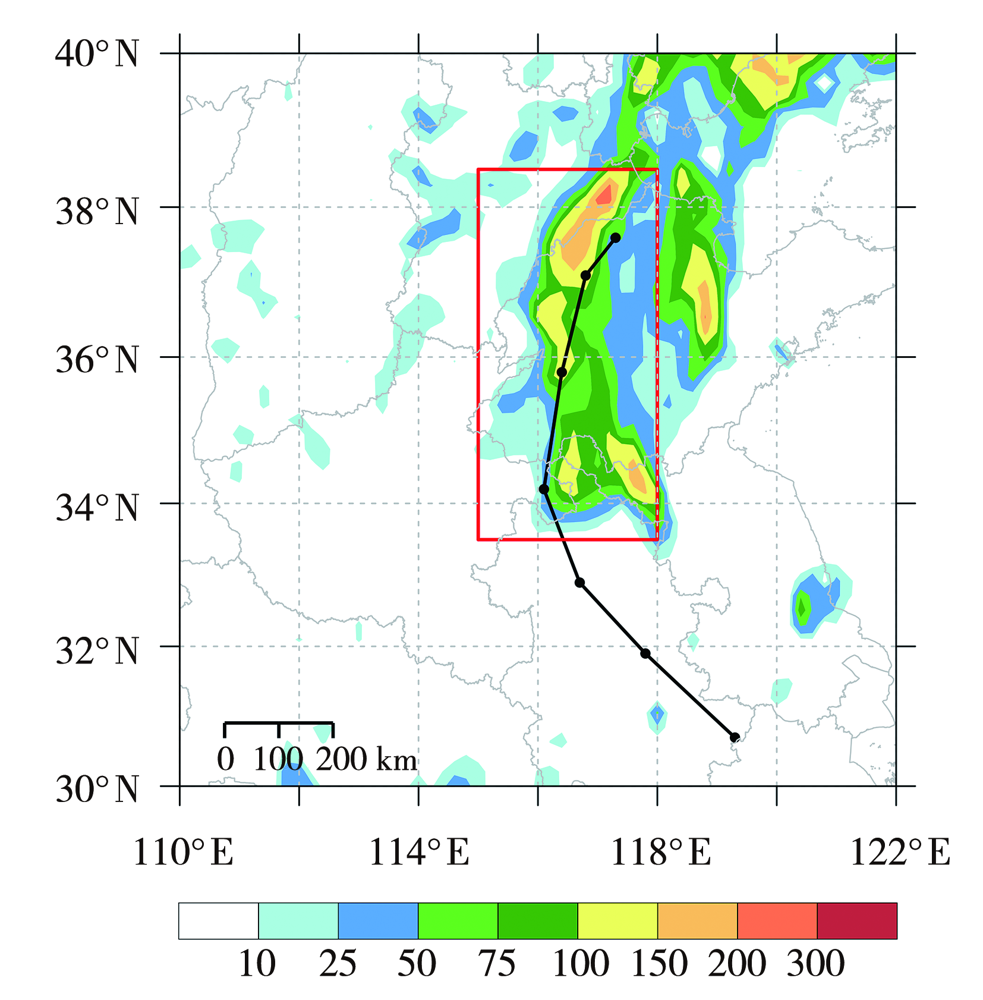
图1. 2018年8月13日08:00至14日20:00逐6 h台风路径(黑色点线)及8月13日20:00至14日20:00 24 h累计降水量(彩色填色区,单位:mm)
(红色方框为敏感性分析中计算平均海平面气压和10 m风速的区域。下同)
Fig.1. The typhoon track at 6 h interval (black dots and line) from 08:00 BST 13 to 20:00 BST 14 and 24 h accumulated precipitation (color shaded areas, Unit: mm) from 20:00 BST 13 to 20:00 BST 14 August 2018
(The red box shows the area where the average sea level pressure and 10 m wind speed are calculated in the sensitivity analysis. the same as below)