2019年7月上半月中国南方降水异常偏多成因分析
Analysis on causes of precipitation anomaly in southern China in the first half of July in 2019
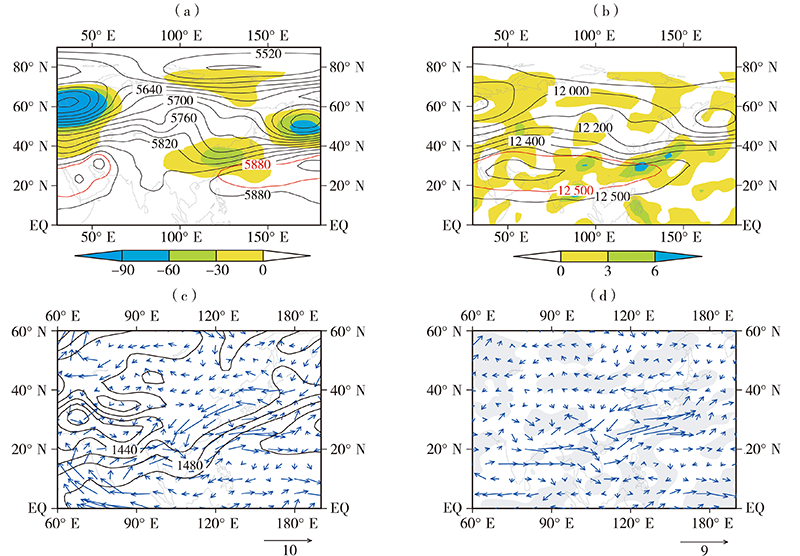
(a、b、c,黑色等值线,单位:gpm)、位势高度距平场(a,彩色填色区,单位:gpm)、散度距平场(b,彩色填色区,单位:10-6s-1)、风场距平(c,箭矢,单位:m·s-1)、水汽通量距平(d,箭矢,单位:10-3g·hPa-1·cm-1·s-1)及水汽通量散度距平场(d,灰色填色区为水汽辐合区,单位:10-8g·hPa-1·cm-2·s-1)(红色实线分别为气候平均态5880 gpm线及12 500 gpm线)
(a, color shaded areas, Unit: gpm), divergence anomaly field (b, color shaded areas, Unit:10-6 s-1),wind anomaly field (c, vectors, Unit: m·s-1), water vapor flux anomaly field (d, vectors,Unit:10-3g·hPa-1·cm-1·s-1) and water vapor flux divergence anomaly field (d, grey shaded areas represents convergence areas,Unit:10-8g·hPa-1·cm-2·s-1) at 500 hPa (a),200 hPa (b),850 hPa (c) and 700 hPa (d) in the first half of July in 2019(The red solid lines are 5880 gpm line and 12 500 gpm line of climate mean state, respectively)