六盘山区一次典型暴雨过程的地形敏感性模拟试验
|
|
马思敏, 穆建华, 舒志亮, 孙艳桥, 邓佩云, 周楠
|
Topography sensitivity simulation test of a typical rainstorm process in Liupan Mountain region
|
|
MA Simin, MU Jianhua, SHU Zhiliang, SUN Yanqiao, DENG Peiyun, ZHOU Nan
|
|
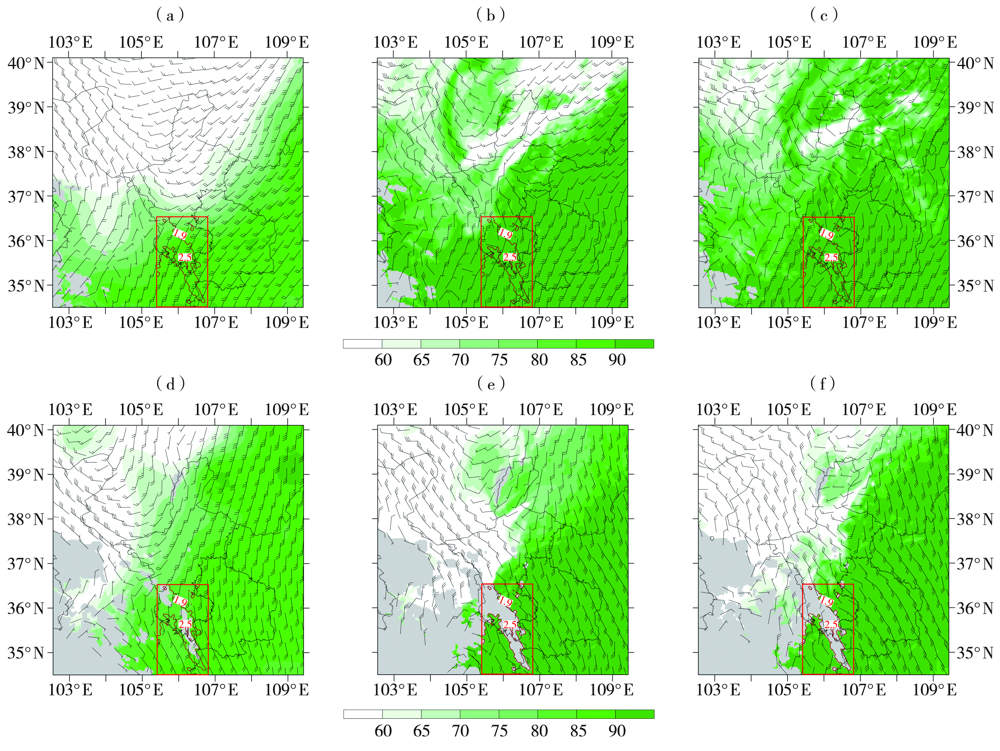
图5 2018年7月10日08:00(a、d)、14:00(b、e)、17:00(c、f)模拟的700 hPa(a、b、c)与800 hPa(d、e、f)风场(风矢,单位:m·s-1)和相对湿度(填色区,单位:%)分布
(蓝色实线为切变线,黑色椭圆表示辐合上升区域,灰色区域为地形以下缺测区域。下同)
|
Fig.5 Simulated wind field (wind vectors, Unit: m·s-1) and relative humidity (color shaded, Unit: %) distribution at 700 hPa (a, b, c) and 800 hPa (d, e, f) at 08:00 BST (a, d), 14:00 BST (b, e) and 17:00 BST (c, f) 10 July 2018
(The blue solid line is shear line, the ellipse is convergence rising area, the gray area is the missing measurement area below the terrain. the same as below)
|
|
|
|
|