六盘山区一次典型暴雨过程的地形敏感性模拟试验
Topography sensitivity simulation test of a typical rainstorm process in Liupan Mountain region
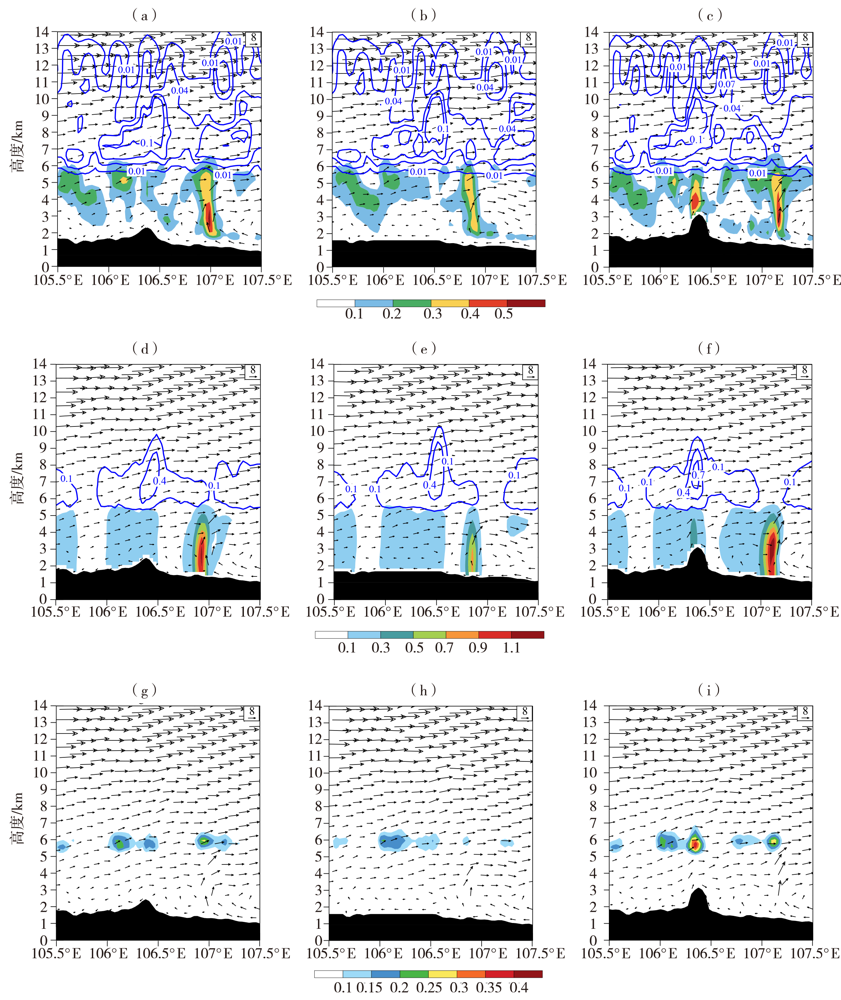
(a, d, g) CTRL, (b, e, h) H1.7 km, (c, f, i) H1.25
(a、d、g)CTRL,(b、e、h)H1.7 km,(c、f、i)H1.25
六盘山区一次典型暴雨过程的地形敏感性模拟试验 |
| 马思敏, 穆建华, 舒志亮, 孙艳桥, 邓佩云, 周楠 |
|
Topography sensitivity simulation test of a typical rainstorm process in Liupan Mountain region |
| MA Simin, MU Jianhua, SHU Zhiliang, SUN Yanqiao, DENG Peiyun, ZHOU Nan |
| 图10 2018年7月10日14:00—20:00 3组地形试验模拟的过累计降水量最大值处的云水(填色区)和冰晶(蓝色等值线)(a、b、c)、雨水(填色区)和雪(蓝色等值线)(d、e、f)及霰(填色区)(g、h、i)平均混合比(单位:g·kg-1),u、w合成风矢量(箭头,w×10,单位:m·s-1)的经度-高度剖面 (a, d, g) CTRL, (b, e, h) H1.7 km, (c, f, i) H1.25 |
| Fig.10 The longitude-height profiles of simulated mean mixing ratio (Unit: g·kg-1) of cloud water (color shaded) and ice crystals (blue isolines) (a, b, c), rain water (color shaded) and snow (blue isolines) (d, e, f), graupel (color shaded) (g, h,i) and composite u,w wind vector (arrows, w×10, Unit: m·s-1) across the area with maximum accumulated precipitation for different tests from 14:00 BST to 20:00 BST 10 July 2018 (a、d、g)CTRL,(b、e、h)H1.7 km,(c、f、i)H1.25 |
|
|