华北地区一次对流激发重力波的卫星观测和数值模拟研究
Satellite observation and numerical simulation of gravity wave excited by a convection over North China
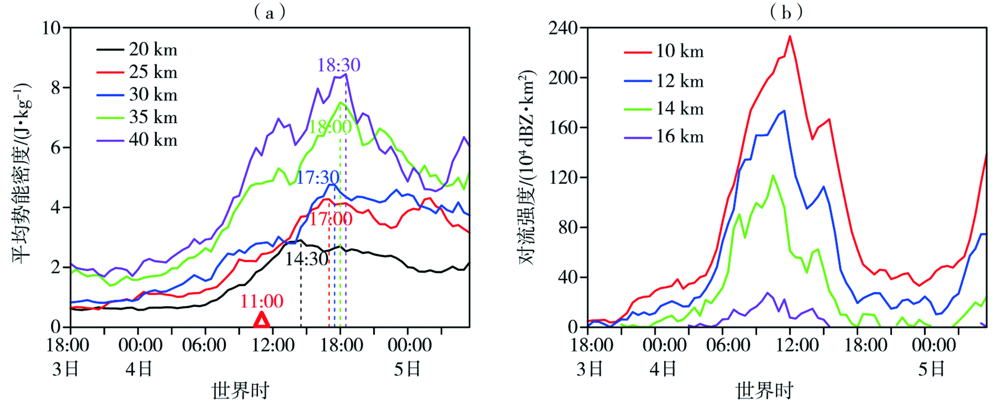
(虚线指示不同高度平均势能密度达到峰值的时间,红色三角形对应对流最强时刻)
(The dotted lines are the corresponding time with the peak value of average potential energy per unit mass at different heights, and the red triangle marks the moment for strongest convection)