基于CMIP6的福建省极端气温预估
Projection of extreme temperature in Fujian based on CMIP6 output
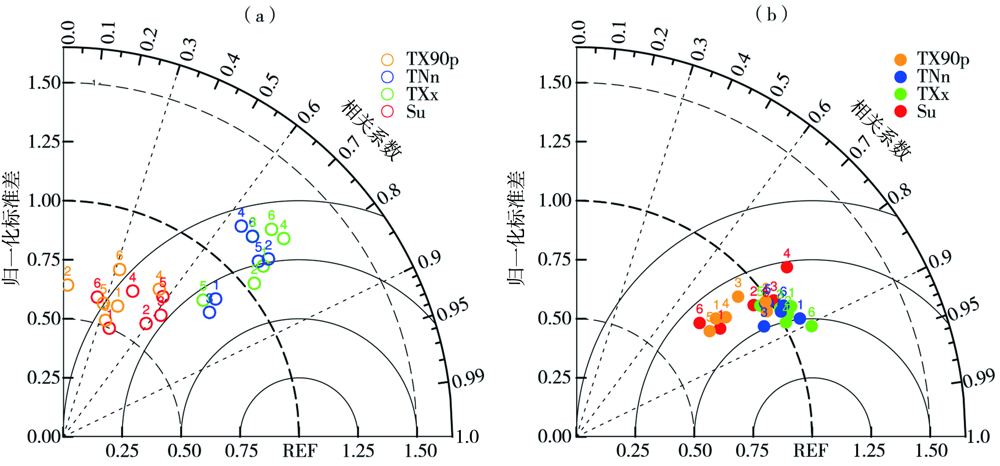
(a) QM偏差订正前,(b) QM偏差订正后(1~6对应
(a) before bias correction by QM method,(b) after bias correction by QM method(numbers 1 to 6 correspond to the model serial number in
基于CMIP6的福建省极端气温预估 |
| 陈笑晨, 唐振飞, 陈锡宽, 郑潮宇, 李欣欣, 杨婷 |
|
Projection of extreme temperature in Fujian based on CMIP6 output |
| CEHN Xiaochen, TANG Zhenfei, CHEN Xikuan, ZHENG Chaoyu, LI Xinxin, YANG Ting |
| 图1 历史参照期福建省4个极端气温指数模拟场相对于观测场的泰勒图 (a) QM偏差订正前,(b) QM偏差订正后(1~6对应 |
| Fig.1 Taylor diagrams of simulated fields of four extreme temperature indices relative to observation fieldsin Fujian Province during historical reference period (a) before bias correction by QM method,(b) after bias correction by QM method(numbers 1 to 6 correspond to the model serial number in |
|
|