连续两次飑线大风成因对比分析
Comparative Analysis of Causes of Two Consecutive Squall Line Gales
(阴影区域风速大于16 m·s-1)
(the shaded area with wind speed greater than 16 m·s-1)
连续两次飑线大风成因对比分析 |
| 竹利,卢德全,廖文超,郑淋淋 |
|
Comparative Analysis of Causes of Two Consecutive Squall Line Gales |
| Li ZHU,Dequan LU,Wenchao LIAO,Linlin ZHENG |
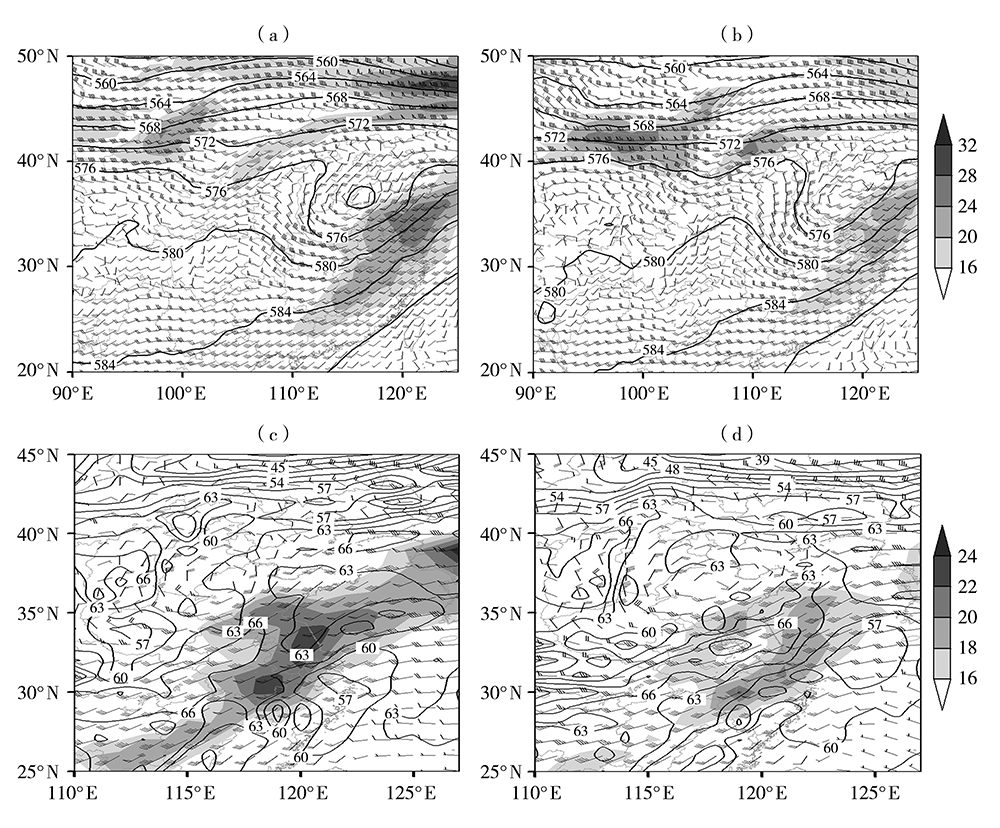
| 图2 2018年5月16日14:00(a、c)和20:00(b、d)500 hPa位势高度(等值线,单位:dagpm)、风场(风向杆,单位:m·s-1)(a、b)以及700 hPa假相当位温(等值线,单位:℃)、风场(风向杆,单位:m·s-1)(c、d) (阴影区域风速大于16 m·s-1) |
| Fig.2 The 500 hPa geopotential height (isoline, Unit: dagpm), wind field (wind stem, Unit: m·s-1) (a, b) and 700 hPa potential pseudo equivalent temperature (isoline, Unit: ℃), wind field (wind stem, Unit: m·s-1) (c, d) at 14:00 BST(a, c) and 20:00 BST (b, d) on 16 May 2018 (the shaded area with wind speed greater than 16 m·s-1) |
|
|